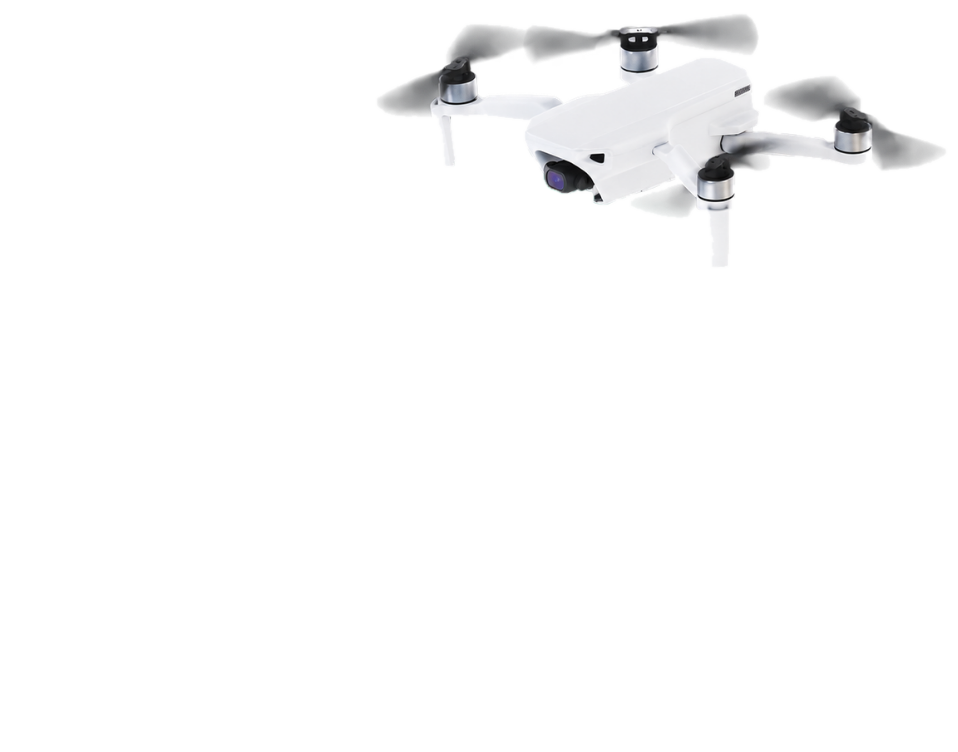
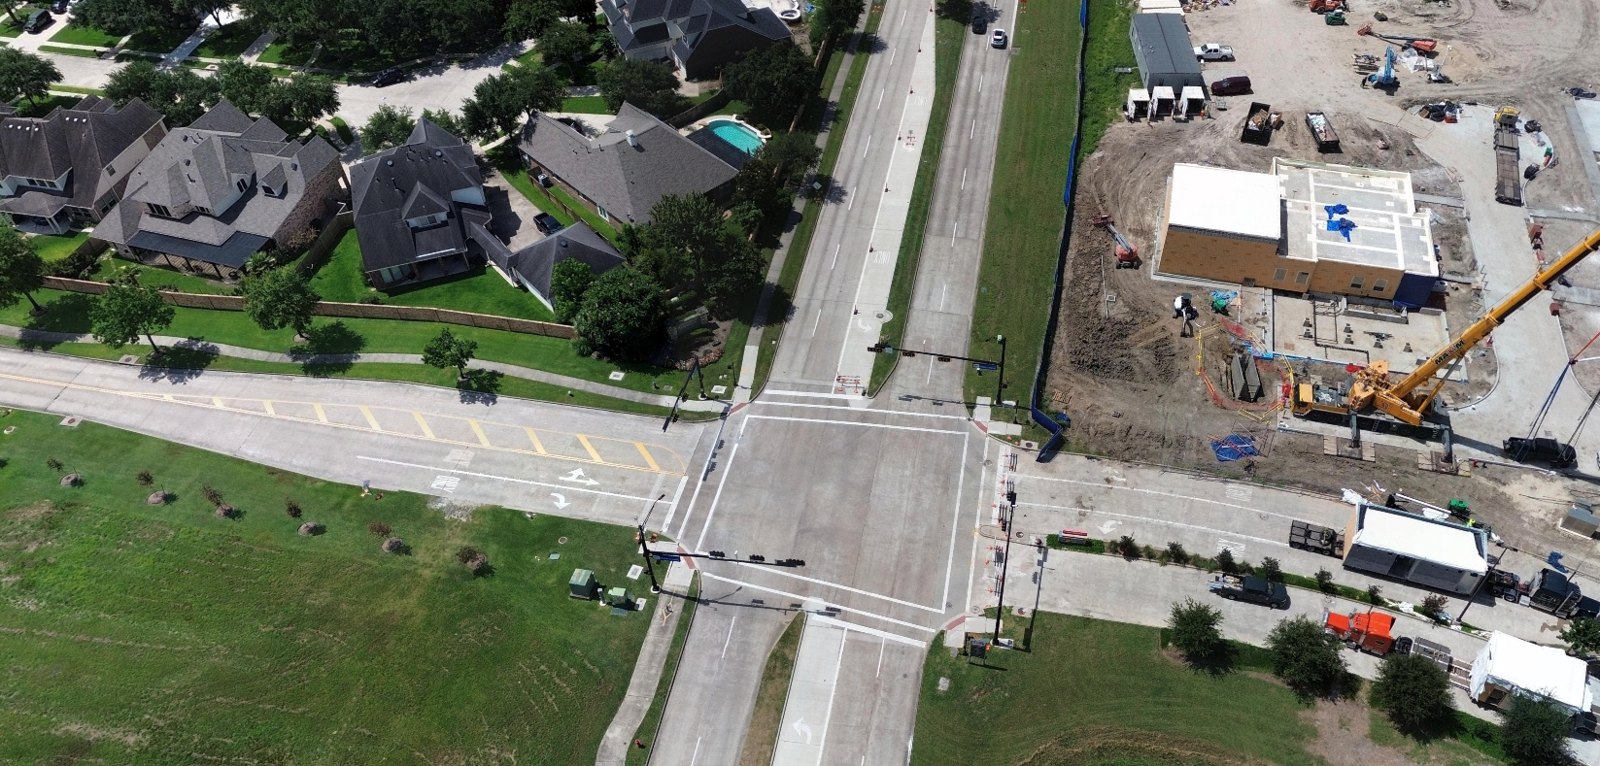
Current drone imagery for the municipalities and utilities that keep city infrastructure running.
Every square inch in your service area is recaptured at least once every six months, with additional fresh captures made available within 72 hours when you request it.
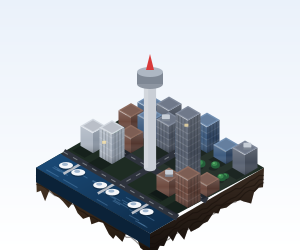
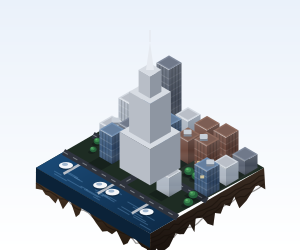
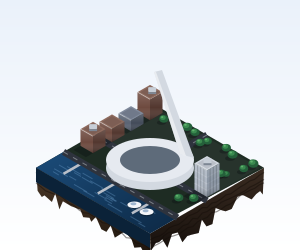
Crews fill the gaps with phone photos, PDFs and email threads. Then someone in GIS has to sort it all.
Every request waits on someone to find the right file.
Three photos of the same pole, three different dates.
Teams act on whichever file they found first.
Living Coverage is the shared source of structured ground truth,
keeping teams aligned to the current reality of city conditions.
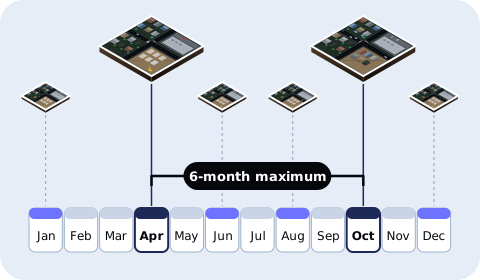
No image is ever more than six months old.

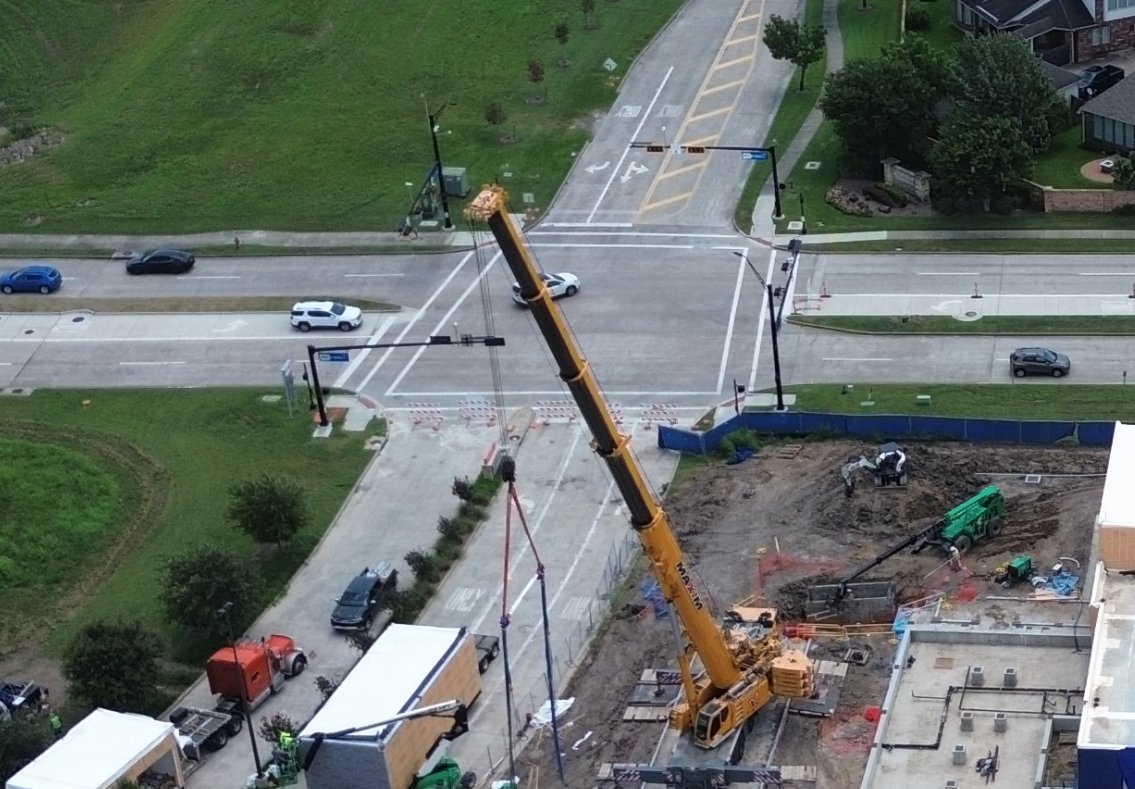
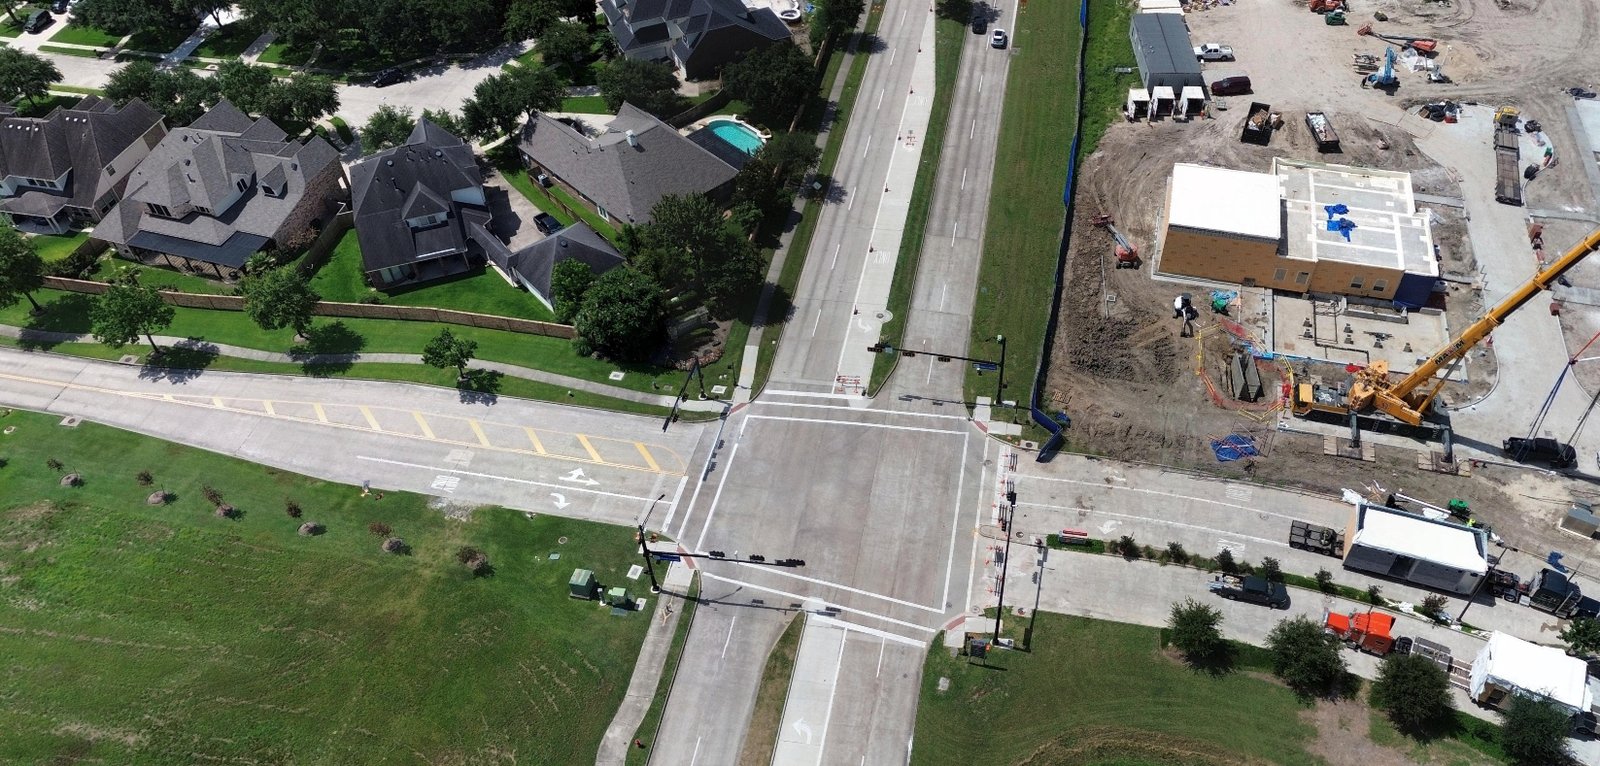
High-resolution orthos, angled imagery, and 360-degree views.
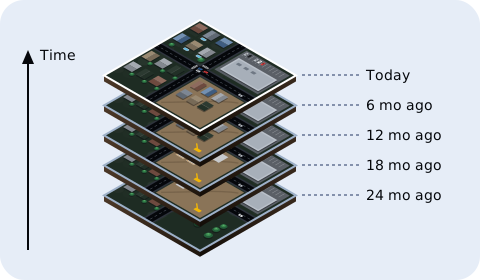
Captures already on file are included, so you can compare before and after.
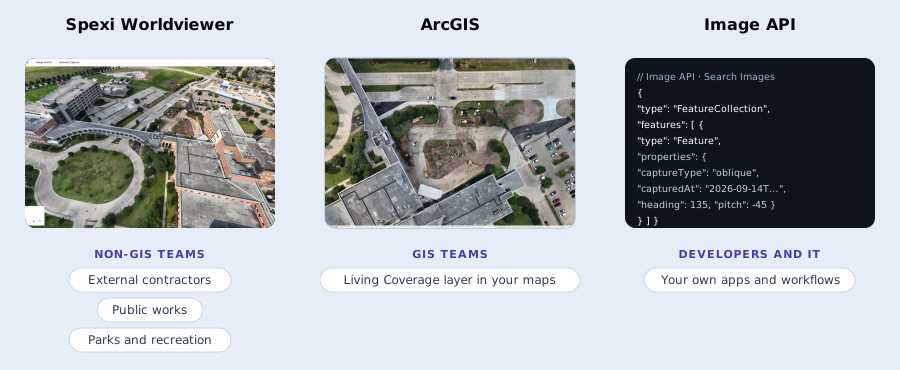
Pull imagery into ArcGIS, Spexi Worldviewer, or your own apps through the Image API.
How it works
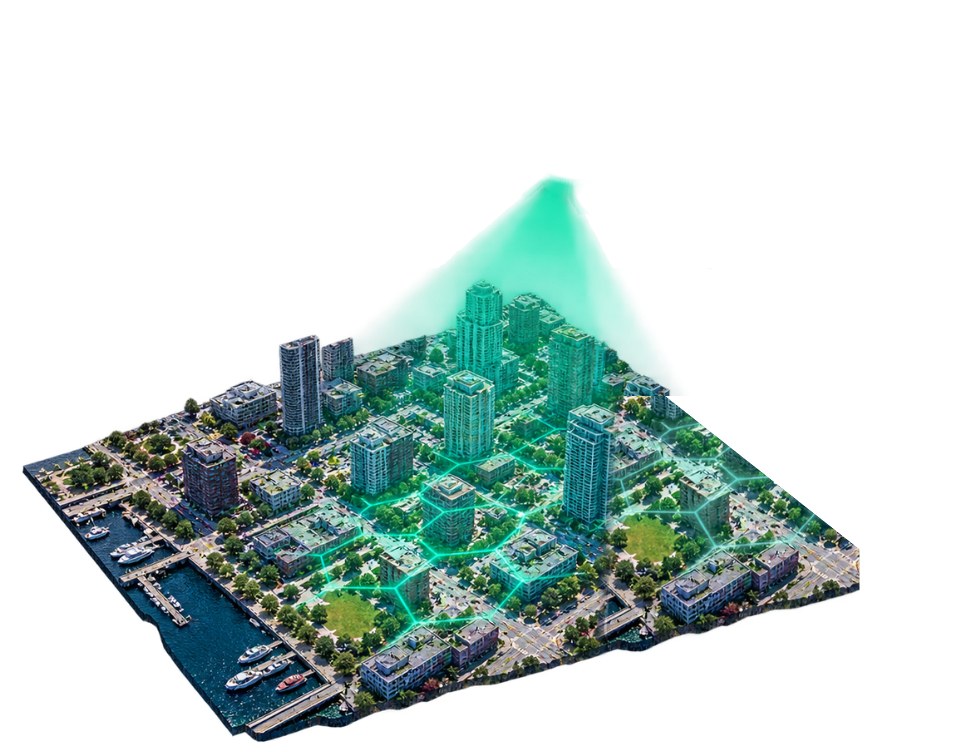
Spexi divides your city into Spexigons, standard units of 25 acres (0.1 sqkm).
Local drone pilots fly automated flight plans, standardizing structured imagery data.
Standardized capture area
Multi-capture angles
Nadir and oblique views on every capture.
2.8 cm resolution
Ground sample distance per pixel.
Resolution
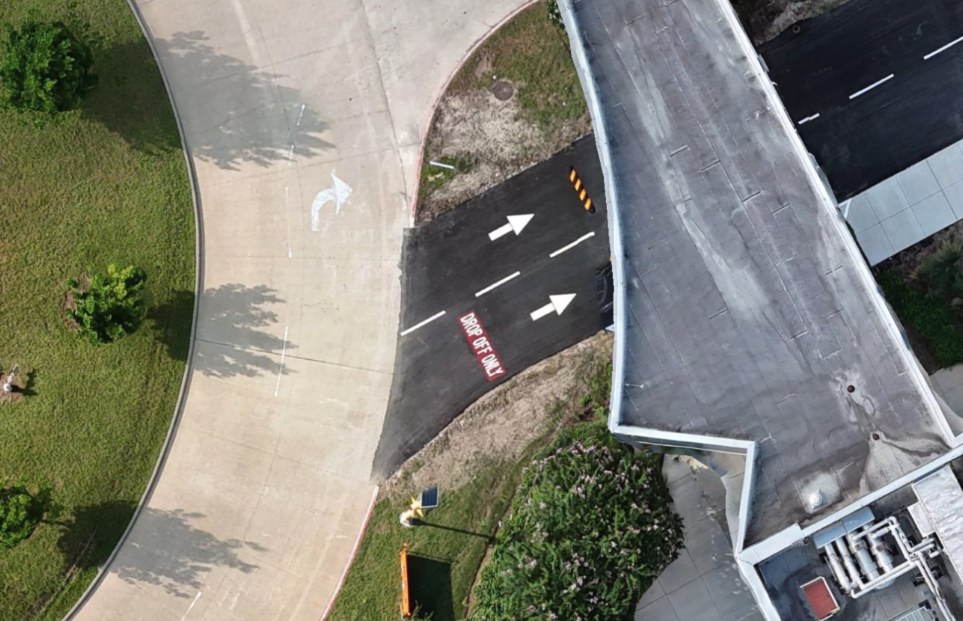
Spexi drone capture
2.8 cm per pixel
Everything in a Living Coverage subscription, at a glance.
6 months
Maximum image age
2.8 cm
Resolution (GSD)
5 angles
1 straight-down, 4 oblique
72 hrs
On-demand capture (add-on)
See what's been built, cleared, or subdivided since the last cycle, and keep land-use layers current.
Confirm new builds, additions, and demolitions before the annual roll closes.
Keep road, sidewalk, and right-of-way layers current, and plan capital work from conditions no more than six months old.
Monitor trails, tree canopy and park assets across every site, and check storm damage before sending crews out.
Track vegetation growth and right-of-way encroachment around distribution assets inside city limits, season over season.
Keep a pre-event baseline on file that's never more than six months old. After an event, add on-demand capture within 72 hours.
Explore Living Coverage
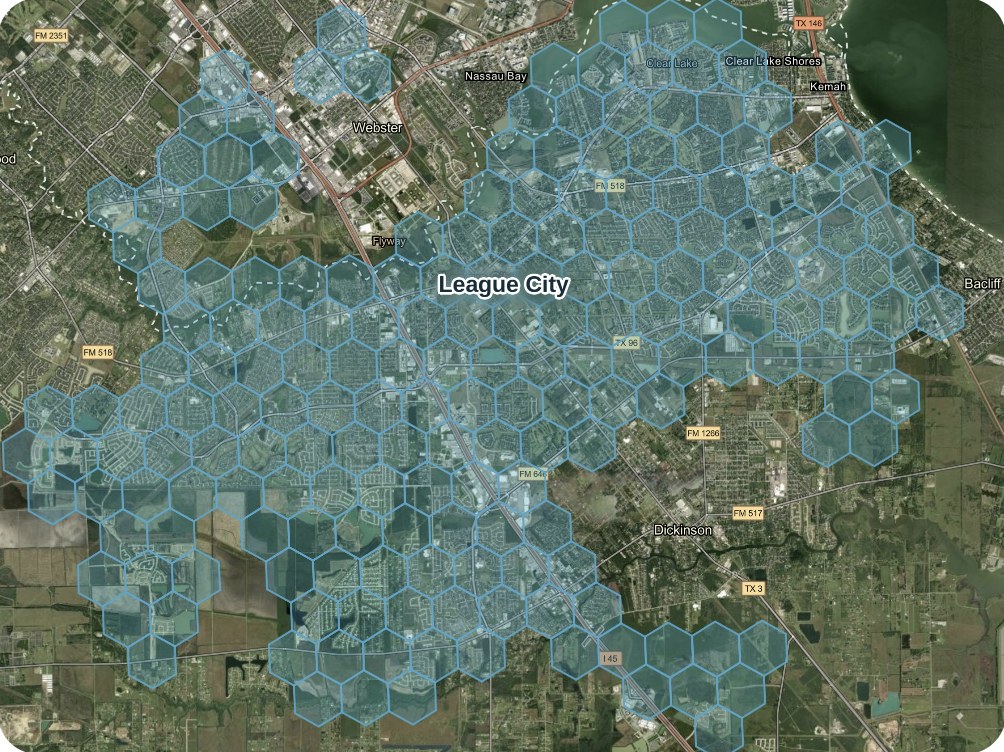
One of the fastest-changing suburbs in the Houston metro, with 25,000+ acres of living coverage. Explore static and ortho imagery yourself.
3,000+
acres of land transformation
4,000+
homes in progress
$1 billion+
in active development
Still have a question? Our team can walk you through coverage in your area.
Every area is recaptured at least every six months. If an area goes past six months, Spexi recaptures it and credits your account.
Subscriptions (referred to as entitlements) cover Spexi coverage zones, which include 100+ major U.S. and Canadian cities. Outside those zones, you can order one-off captures or buy existing imagery. Contact Sales to request a new area.
Static Images in nadir and oblique views, plus Standard or Aligned Orthomosaics as add-ons. Imagery is delivered through the Image API, Spexi Worldviewer, or ArcGIS.
Yes. Living Coverage imagery is available in ArcGIS through the Spexi Content Store for ArcGIS.
Your whole organization can use it in your own maps, reports and apps for the life of your subscription. U.S. customers’ data is stored in the U.S., and Canadian customers’ data in Canada.